Decentralised real-time data with OSIsoft PI System and Twitter
Abstract
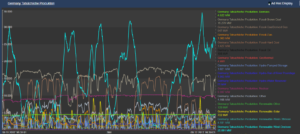
As data analysis tools continue to evolve, it becomes clear that the DA process starts with simple visual presentations and an easy data access. By using Gantt charts, the dependencies between activities and their status are easily displayed. Originally from project management, WERUSYS has improved the idea to become real-time capable and automatically updatable for PI Vision. But even more important than the representation of the data is the preparation and provision of the information. Here we use Twitter as a Publish/Subscribe mechanism to provide a unified, high-throughput on a low-latency platform for handling real-time data feeds. The storage is to be considered as a distributed message queue architecture. So the availability of the data is ubiquitous.
Projekt
Global energy consumption has been rising steadily since the beginning of the 1990s. In order to achieve the reduction of energy consumption formulated in global energy concepts, strong saving measures are required. Of course all starts locally in your own company, city, fedaral state or country. Controlling and timing of these kind of consumption and activities needs to be monitored. The information streams should be stored data safely in a distributed, replicated, fault-tolerant cluster. But even more important is to have heterogeneous information in juxtaposition with each other. In this example we allocate the real time power consumption of Germany in PI and as an instance of some activities the state of some turbine or engine. We aggregate the data and send it to Twitter. The visualization is taking place in PI Visual. Customers (e.g. data analysts, operators of powerplants and smart cities) subscribe to needful
data streams.
Technology
The real time raw data is stored a PI server.
 Frequently the data is being analyzed, aggregated and published in several data streams into Twitter. Data aggregation and analysation finds place within PI Analytical Framework. The aggregated Data will be read over PI WebAPI into our “news service” written in C# and published to Twitter.
Locally, the operator has the ability to visualize his own local data directly within existing PI Vision Controls or the decentralized foreign data with the WERUSYS-Timeline PI Vision Control. The WERUSY-Timeline Control is based on Angular, vis.js and node.js for the Twitter interface.

To run this sample, you have to register at twitter, create a twitter application and insert your keys at „server.js“.


